


FTSE AIM – market update and analysis report
AIM Now and Next: The story so far and the road ahead
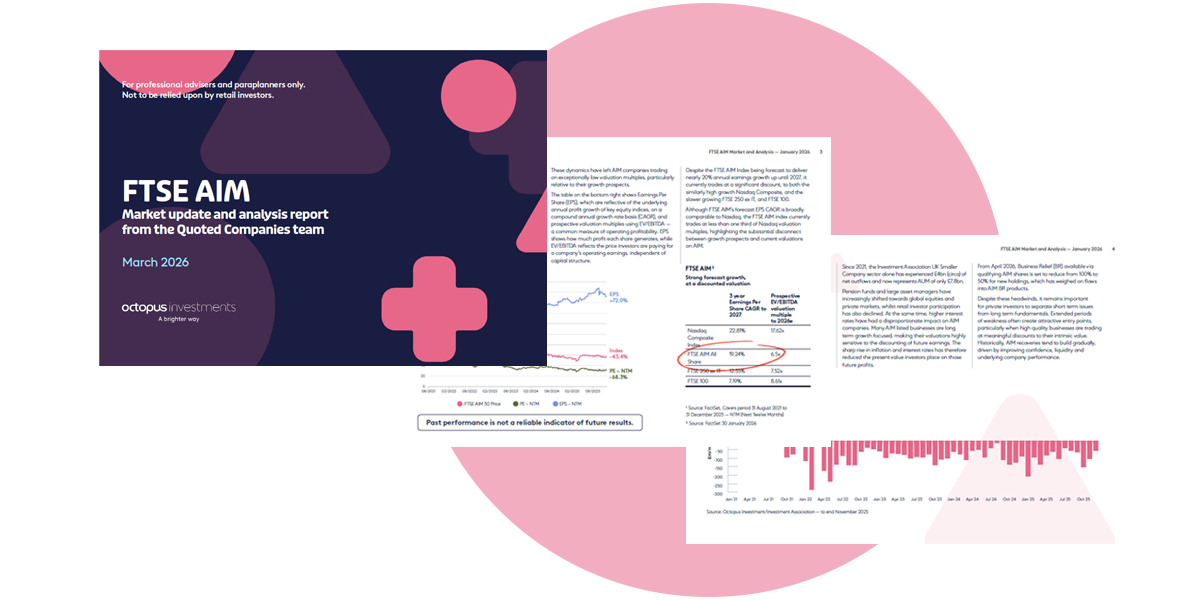
The FTSE AIM market has experienced a more prolonged and sharper decline than seen in previous cycles. For private investors – particularly those using AIM within diversified or tax efficient portfolios- this has prompted understandable questions about whether the current downturn reflects a typical market cycle or a more structural shift.
Download the FTSE AIM market update and analysis report from the Quoted Companies team.
Risks to bear in mind
The value of an investment can fall or rise and you may not get back the full amount you invest.
The shares of small and mid-cap companies should be considered higher risk than those of larger companies listed on main markets such as the FTSE 100. Their share price can rise or fall faster than those of companies listed on a main market, and their shares may also be harder to sell.
Discrete 1-year performance % return to 30 September 2025
| 30/09/2021 | 30/09/2022 | 30/09/2023 | 30/09/2024 | 30/09/2025 | |
| FTSE 100 Total Return | 25.36% | 0.90% | 14.66% | 12.39% | 17.53% |
| FTSE 250 Total Return | 35.69% | -23.50% | 10.00% | 19.11% | 8.18% |
| FTSE 250 ex IT Total Return | 40.85% | -26.79% | 13.62% | 21.41% | 6.69% |
| FTSE Small Cap Total Return | 51.74% | -18.70% | 7.48% | 18.21% | 8.91% |
| FTSE Small Cap ex IT Total Return | 72.45% | -24.37% | 12.72% | 22.38% | 6.36% |
| FTSE AIM Total Return | 30.79% | -34.34% | -8.28% | 3.90% | 7.85% |
| DNSC ex IT Total Return | 45.93% | -25.12% | 11.83% | 20.01% | 8.89% |
| NASDAQ Total Return | 24.90% | -10.93% | 15.34% | 26.16% | 24.96% |
Past and forecast performance is not a reliable indicator of future results.
Source: Lipper 30/09/2025