


Dividend Barometer Report
Barometer (n.) Showing how a particular situation is developing, or how people’s opinions on a particular matter are changing.
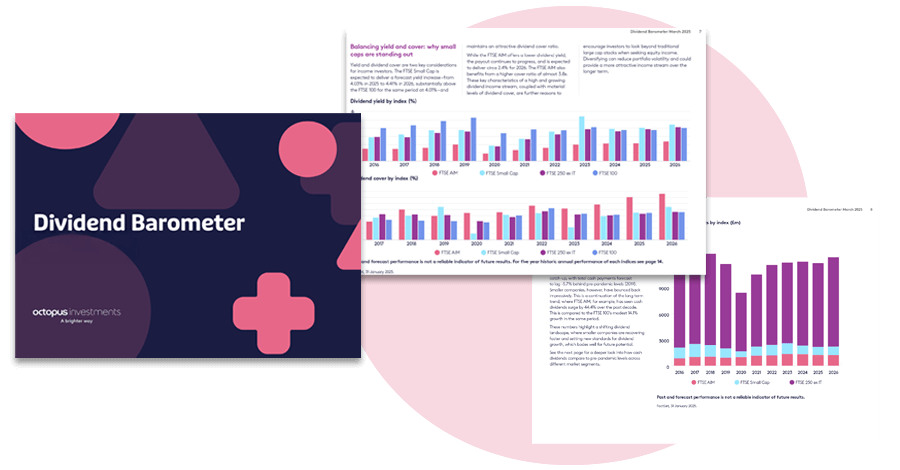
The Dividend Barometer is a report, compiled by the Quoted Companies Team at Octopus Investments, which champions the lesser-known dividend credentials of small and mid-cap income stocks.
Headlines
![]()
The FTSE SmallCap, FTSE 250 and FTSE AIM all outperformed their FTSE 100 peers in the six months from end of March but valuations remain low.1
![]()
Total cash dividend payouts have dipped this year but are currently forecast to deliver double-digit growth once again for the year to 2026.1
![]()
Smaller-cap-focused indices offer greater dividend cover and less concentration than the FTSE 100.1
Past and forecast performance is not a reliable indicator of future results.
Download the full report to discover the companies we’ve identified as our dividend diamonds.
Risks to bear in mind
The value of an investment can fall or rise and you may not get back the full amount you invest.
The shares of small and mid-cap companies should be considered higher risk than those of larger companies listed on main markets such as the FTSE 100. Their share price can rise or fall faster than those of companies listed on a main market, and their shares may also be harder to sell.
Discrete 1-year performance % return to 30 September 2025
| 30/09/2021 | 30/09/2022 | 30/09/2023 | 30/09/2024 | 30/09/2025 | |
| FTSE 100 Total Return | 25.36% | 0.90% | 14.66% | 12.39% | 17.53% |
| FTSE 250 Total Return | 35.69% | -23.50% | 10.00% | 19.11% | 8.18% |
| FTSE 250 ex IT Total Return | 40.85% | -26.79% | 13.62% | 21.41% | 6.69% |
| FTSE Small Cap Total Return | 51.74% | -18.70% | 7.48% | 18.21% | 8.91% |
| FTSE Small Cap ex IT Total Return | 72.45% | -24.37% | 12.72% | 22.38% | 6.36% |
| FTSE AIM Total Return | 30.79% | -34.34% | -8.28% | 3.90% | 7.85% |
| DNSC ex IT Total Return | 45.93% | -25.12% | 11.83% | 20.01% | 8.89% |
| NASDAQ Total Return | 24.90% | -10.93% | 15.34% | 26.16% | 24.96% |
Past and forecast performance is not a reliable indicator of future results.
Source: Lipper 30/09/2025
1 Source: Lipper, 30 September 2025