


Why now could be the time to revisit UK growth companies
So far in 2023 UK equity markets have delivered a subdued performance, especially when you consider some of the returns being posted elsewhere. The NASDAQ stock exchange in New York, in particular has delivered an impressive 30%1 return, albeit this performance has largely been driven by a relatively narrow range of companies.
Whilst economic and geopolitical concerns remain at the forefront of investor concerns, reflecting on the year to date, from a stock specific perspective, it has been a reassuring message conveyed by most companies across our portfolios. Robust trading continues to be reported, companies remain well capitalised, and the outlook remains solid. However, valuations are at a material discount to historic levels presenting a significant opportunity.
Looking back at previous market pull-backs, when the market turns it does so quickly. Following this point of market rotation, as we highlight below, small and mid-cap companies have a history of delivering significant outperformance against their large cap peers.
With the macro-outlook remaining generally steady, and the scope for an interest rate pivot in the next 12 months (which could prove a catalyst for growth companies), we suggest now could be the time to be positioning yourself for the rebound. Are you ready?
UK equity market – Significant valuation gap persists
Over recent years, the UK equity market has fallen out of favour with some investors, helping to push valuations to levels not seen since the financial crisis. Whilst this has in part been driven by political uncertainty since 2016’s vote to leave the European Union, the UK’s underlying economic performance has remained largely in line with developed market peers.
At current levels the UK equity market is now trading at a significant discount against both global developed peers, and against its long-term average.
The below chart highlights that, on a blended valuation basis, the UK is on its lowest valuation rating in 20 years. Whilst the question concerning the market is mid-term corporate profitability, many share prices are arguably already pricing in materially lower potential profits. To date however we have seen a largely resilient operational performance from most reporting companies.
Despite this general resilience, much of the commentary written about the UK economy and in particular, UK public equities of late has a negative slant.
Valuation gap persists
Blended valuations – UK, vs EU ex UK, and US
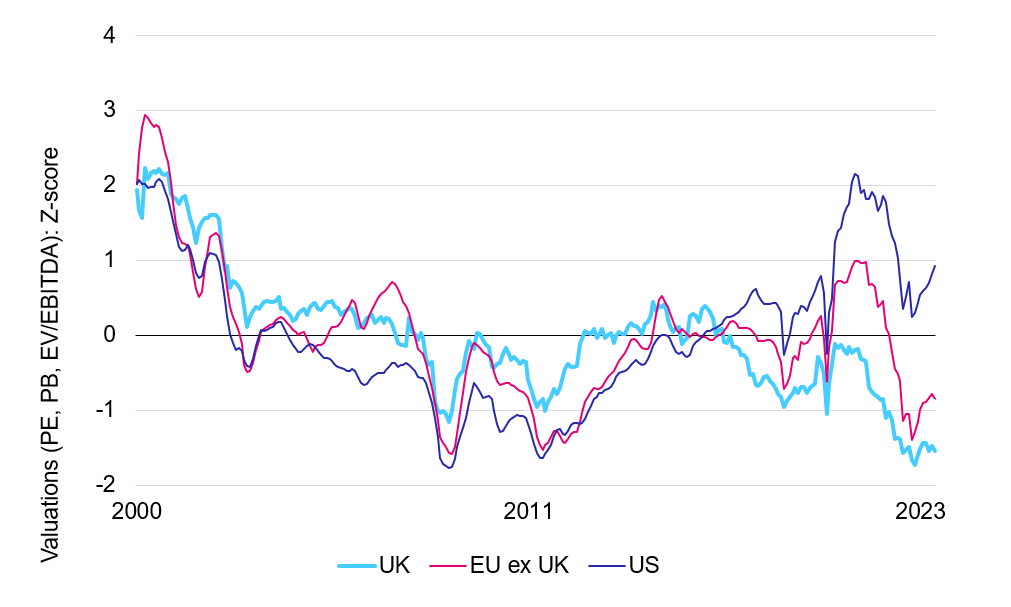
Source: Panmure Gordon 12/06/2023. Figures based on blended PE, PB, EV/EBITDA ratios for respective regions
Standing back to reflect on where we are however, it is worth reminding ourselves that there is almost £5trn invested in UK public equities, with more international companies than any major exchange2.
Whilst capital markets have been relatively quiet, as recently as 2021/22, over £63bn was raised in London capital markets, and London has so far this year raised more capital than any other European Exchange.
The UK market remains an attractive home for public equities. With this solid underpin, and the prospect of some regulatory changes afoot which may encourage wider UK equity ownership, particularly from UK pension funds, this valuation gap against other markets is unlikely to persist.
There has also been a steady recent flow of capital into interest paying money market accounts. Whilst arguably a sensible strategy during times of uncertain equity markets, as the markets recover, investor FOMO will result in a steady flow of capital back to active equities. This will further boost flows, boost returns and we anticipate will accelerate the closure of this valuation gap.
UK Small and mid-cap equities – A rating rarely visited
UK equites are clearly extremely cheap at current levels, however investors should not be limited by the larger listed companies.
Looking outside the FTSE 100 Index, we can see in the chart below that the 2-year forward price to earnings valuation multiple for the FTSE 250 is less than 10x. This is a level tested only a handful of times over the last 20 years for these faster growth small and mid-cap companies, and at a significant discount to the long-term average is against its long-term average of 12.8x. Merely reverting to back to average would generate approximately 30% returns from current levels.
FTSE 250 – FY2 P/E – Current vs average
A bargain rating for growth? Growth multiples at current levels only a handful of times in the last 20 years
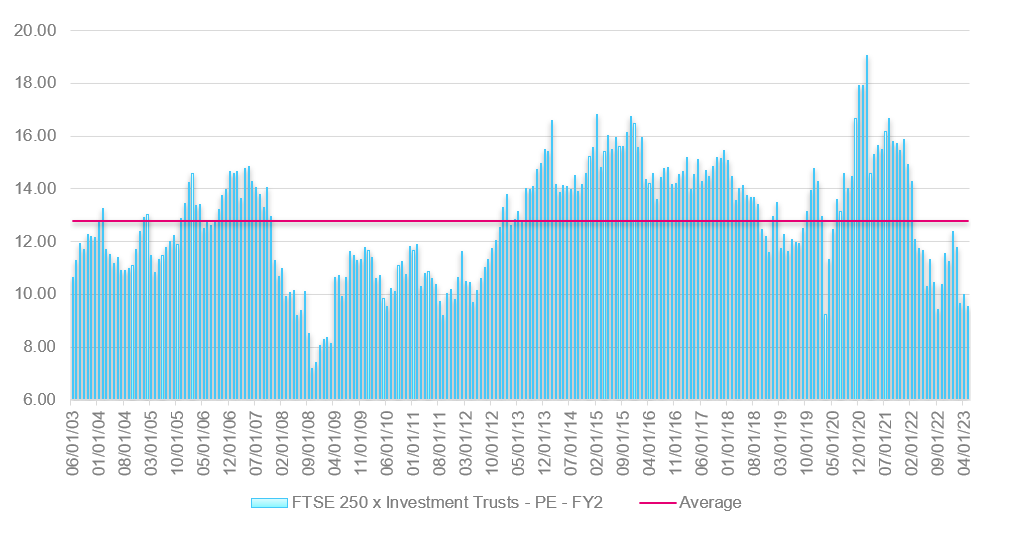
Source: Octopus/Factset 12/06/2023. Figures based on 2 year forward P/E 2003-2023
The FTSE 250 Index has only been below the current forward valuation multiple once in this period, which was during the Great Financial Crisis (GFC). We would certainly suggest that the current environment bears limited resemblance to the challenges faced then.
As we look toward the rest of 2023, we believe the market is likely to look beyond the current economic slowdown and start to focus on recovery. From a newsflow perspective we remain reassured by the trading resilience of most portfolio holdings and suggest many stocks are at levels which are more than pricing in any negative impact on near term potential growth.
With the prospect of central banks starting to lower interest rates at some point over the next 12 months, combined with the current attractive market valuations, growth equities look particularly well positioned for the rebound.
Index multiples vs growth outlook – Smaller is better
Layering on the earnings and dividend growth outlook into the mix, further reinforces the view that small and mid-cap equities warrant consideration.
The chart below highlights that the FTSE 250 Index is trading on a market multiple similar to the FTSE 100 Index, yet the FTSE 250 is offering investors potential compound annual earnings growth for the three years to end 2025 of almost 9%, against the FTSE 100 at close to 1%.
Move down the market cap scale and the valuation dynamics look even more compelling.
The FTSE Small Cap (Excluding investment trusts) Index is trading on a discount to the wider market yet offers potential compound growth of almost double that of the FTSE 250 Index, whilst the FTSE AIM Index, optically looks the most expensive, however offers investors potential compound earnings growth of over 22%.
Current market – Growth & valuation dynamics
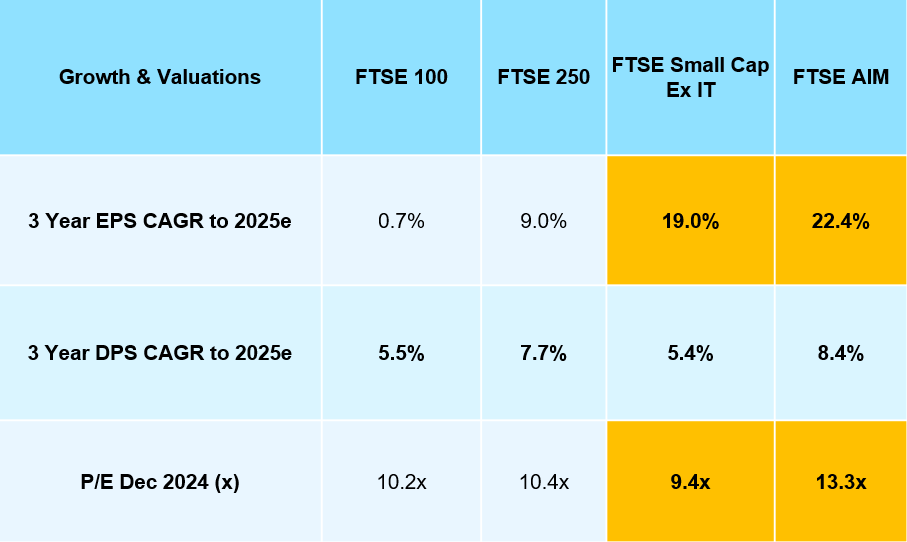
Source: Octopus/Factset 12/06/2023.
Why now? The potential rebound
In the chart below we can see that event post the recent bout of underperformance, over the last twenty years UK smaller company equities have significantly outperformed UK large companies, with actively managed funds again delivering a significantly better than market returns for investors. The growth dynamics discussed go some way to explaining these return variations.
The outperforming IA smaller company sector
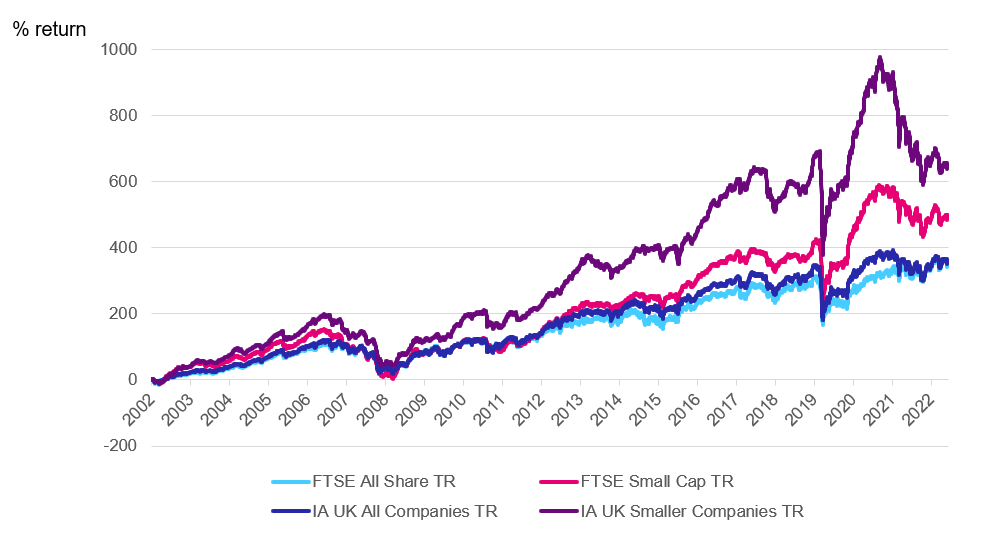
Source: Lipper 31/12/2002 to 08/06/2023
The UK Equity Market is astoundingly cheap. Almost 30% potential return could be on offer to investors by merely seeing current valuation levels revert to historic norms for much of the market. Adding on the growth potential of stocks outside of the FTSE 100 Index, further significantly boosts the possible returns for investors taking a medium to long-term view.
Please remember that past performance is no guarantee of future returns.
We’d like to leave you with one final thought.
Looking back over the last 20 years when market price to earnings multiples have been at current levels, in 2011 and 2020, in the two years post the market bottom, the IA UK All Companies sector rallied by over 40%. The returns were clearly more significant post GFC in 2009 but as we have touched on above, the circumstances were significantly more stressed than where we are currently. In the chart below, what is stand-out about all three market recoveries highlighted is that when the market did turn, the IA UK Smaller Companies Sector delivered another c.20% outperformance against IA All Companies Sector peers on average.
IA UK smaller companies vs IA all companies
Historic post pull back bounce
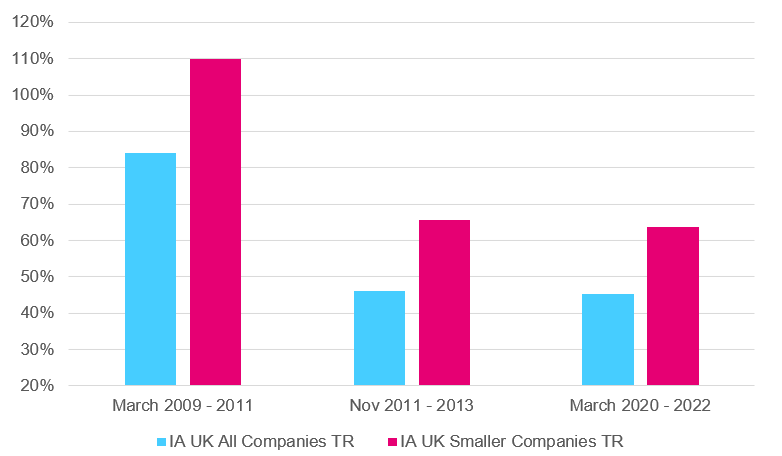
Source: Lipper / Octopus Investments 12/06/2023
Given all the above, by ignoring the potential in UK equities currently, and ignoring UK Small and Mid-Caps in particular, would you wish to miss out on these potential returns when the markets turn?
Are you ready for the rebound?
Discrete 5-year performance % return to end May
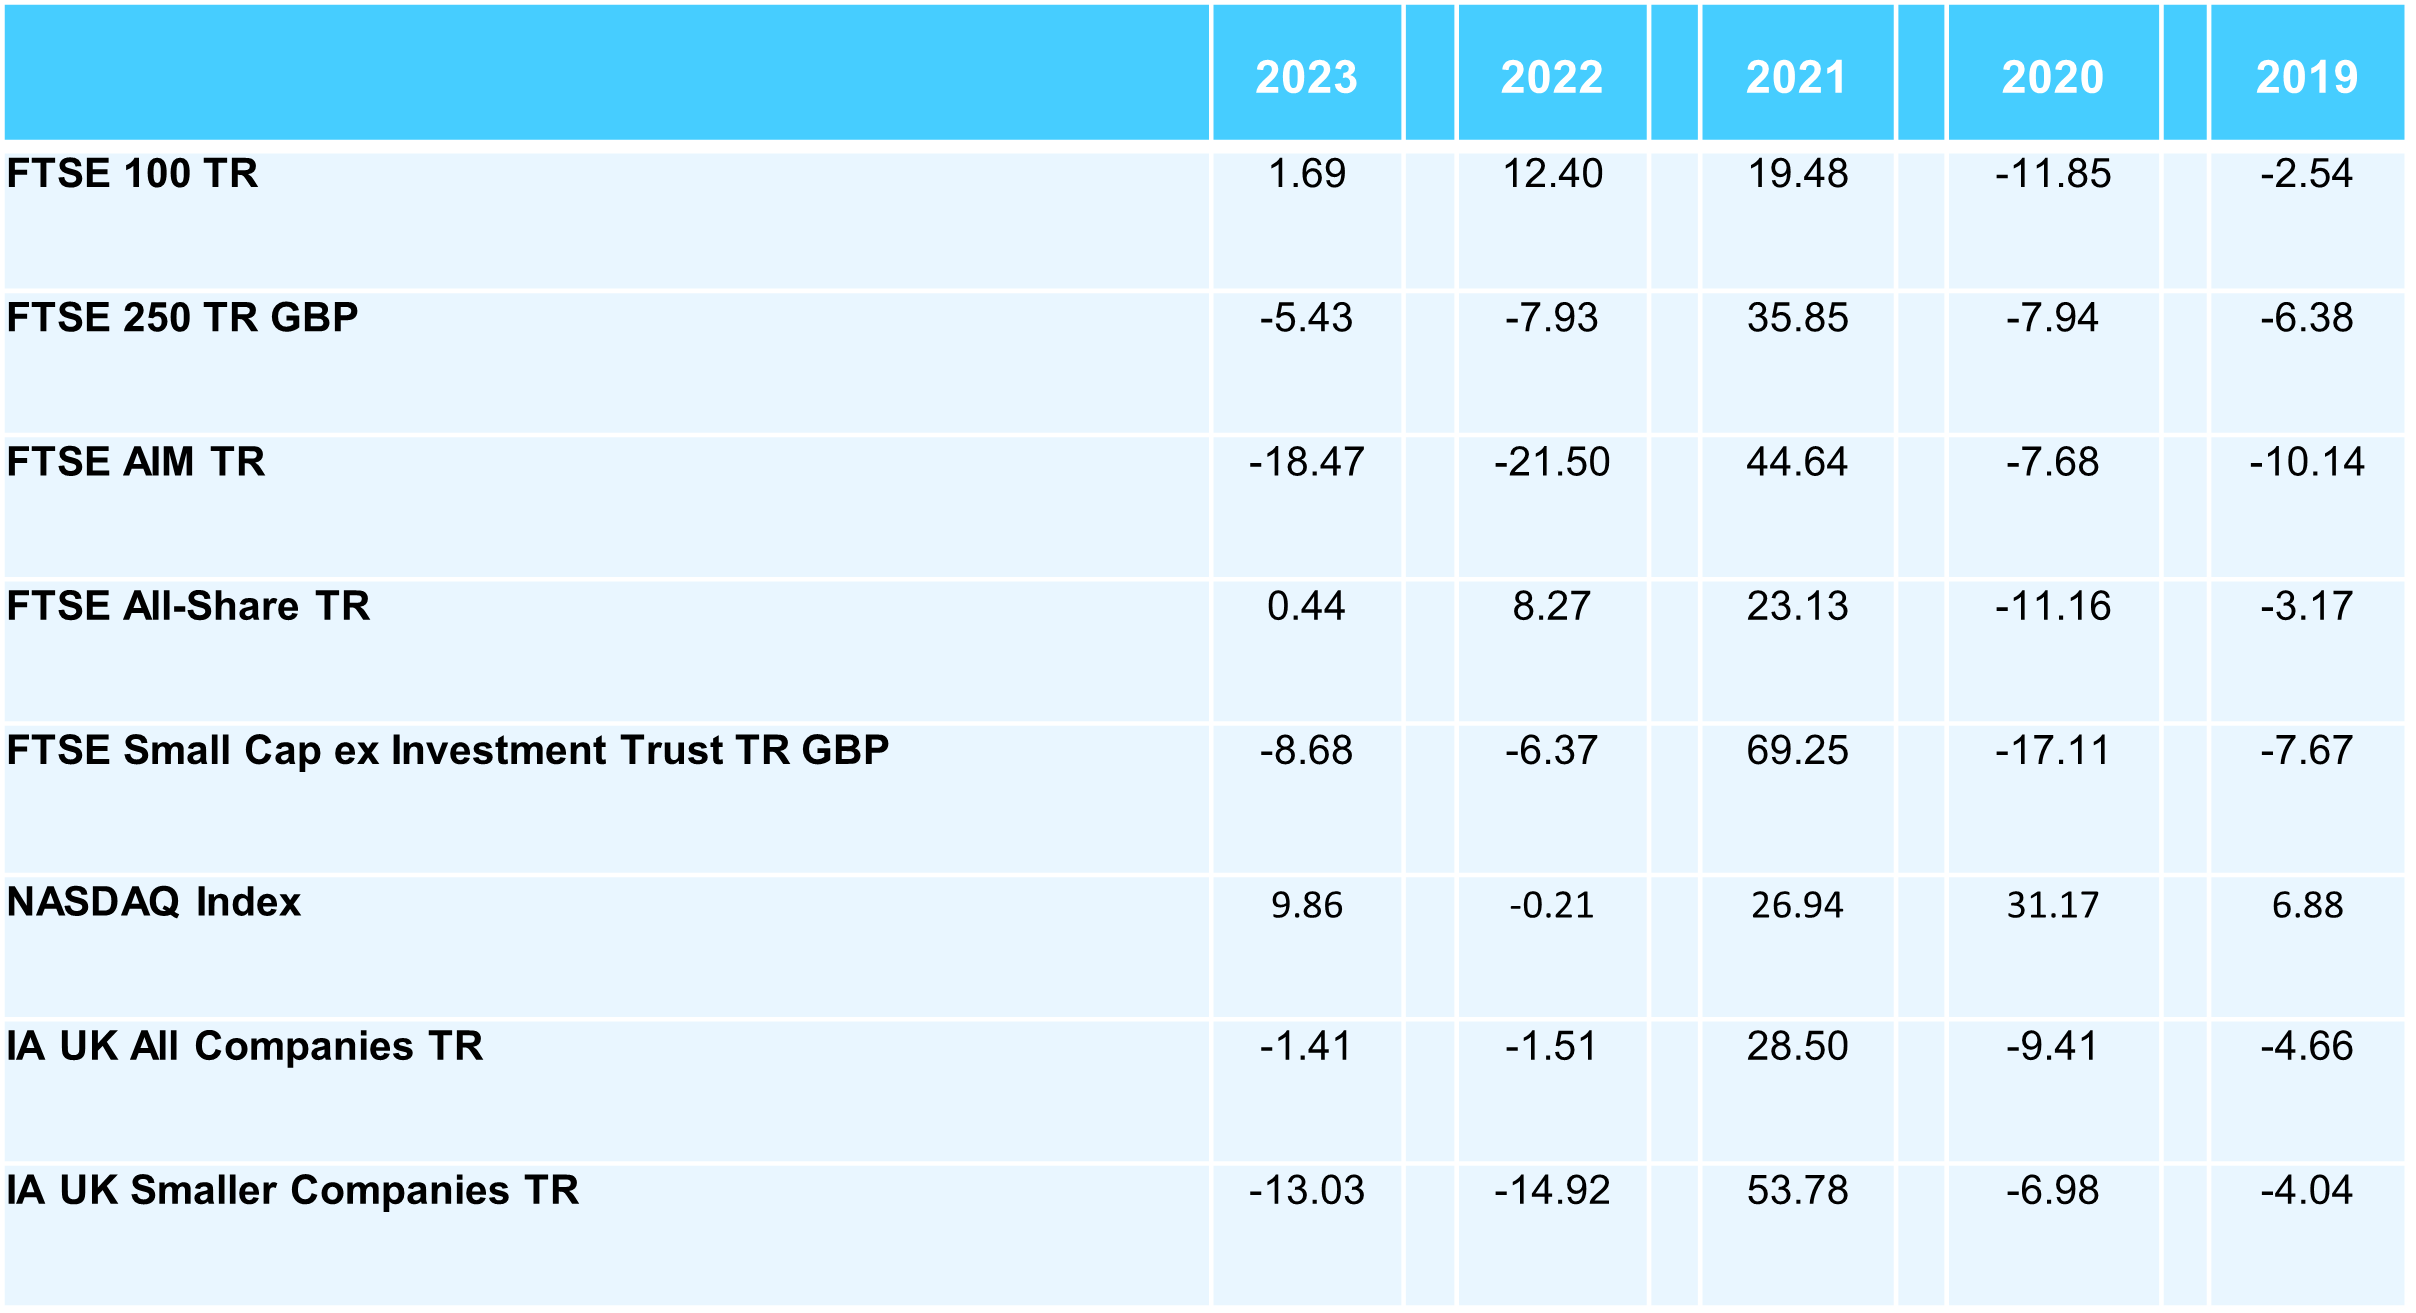
Source: Lipper / Octopus Investments 12/06/2023 to end May
Risks to bear in mind
The value of an investment can fall or rise and you may not get back the full amount you invest. Smaller company shares are also likely to fall and rise in value more than shares in larger, more established companies listed on the main market of the London Stock Exchange. They may also be harder to sell.
1 NASDAQ Index Performance year to 23/06/2023 – Source Factset
2 Source – London Stock Exchange, March 2023